GANNT CHARTS
DYNAMIC AND SIMPLE GANTT CHARTS
PROJECT DETAILS
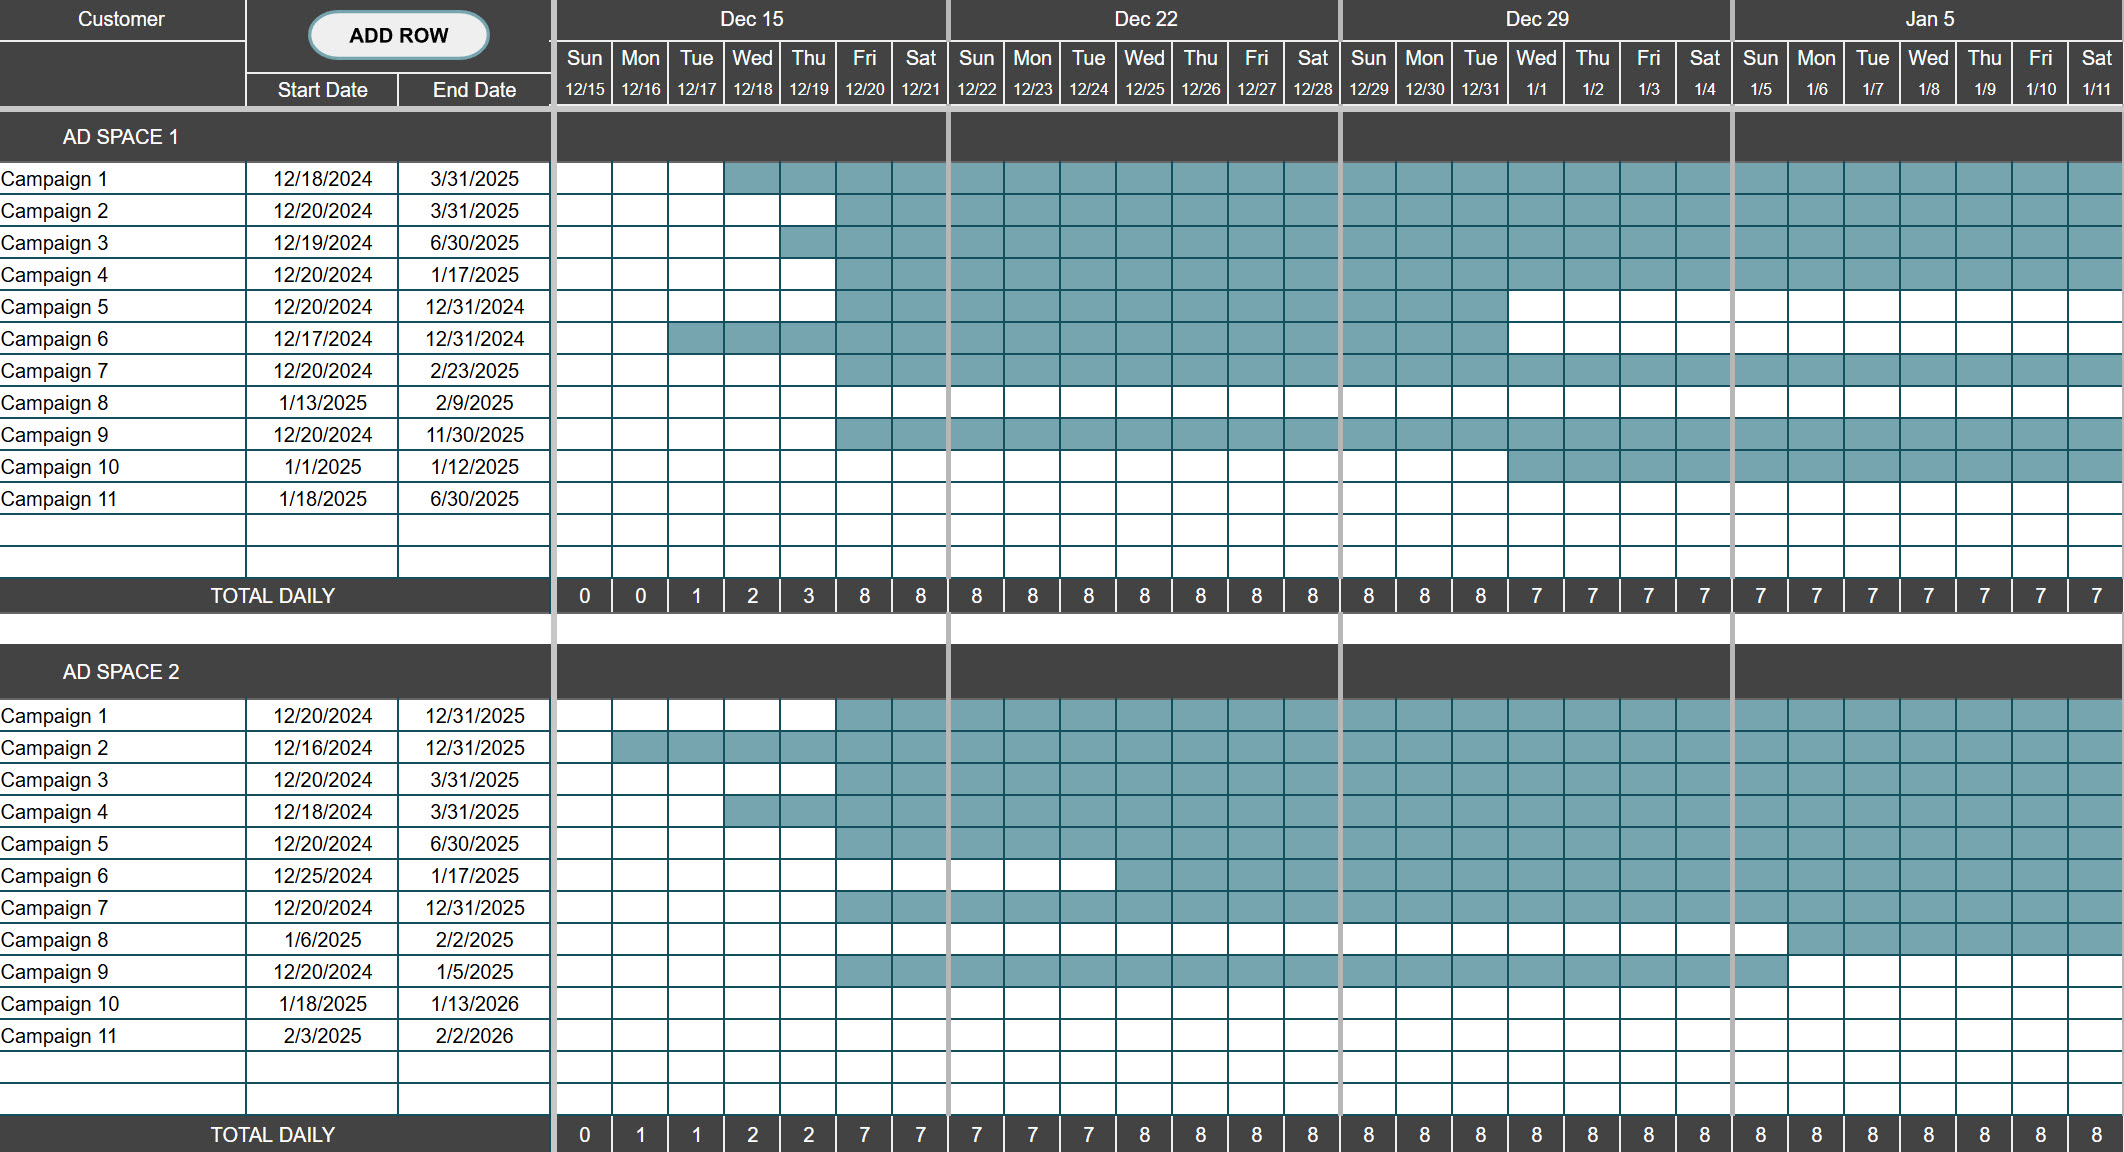
PROBLEM: Needed an easily editable Gantt chart for tracking project tasks or campaigns.
SOLUTION: Built a simple version that only requires a start and end date then totals the campaigns for each segment running per day. Then created a dynamic version with color coding for task management.
FEATURES: Both are easily managed and updated with room to add as many rows as needed. Dynamic version indicates days of week vs weekends, current date, and status of projects by color coding.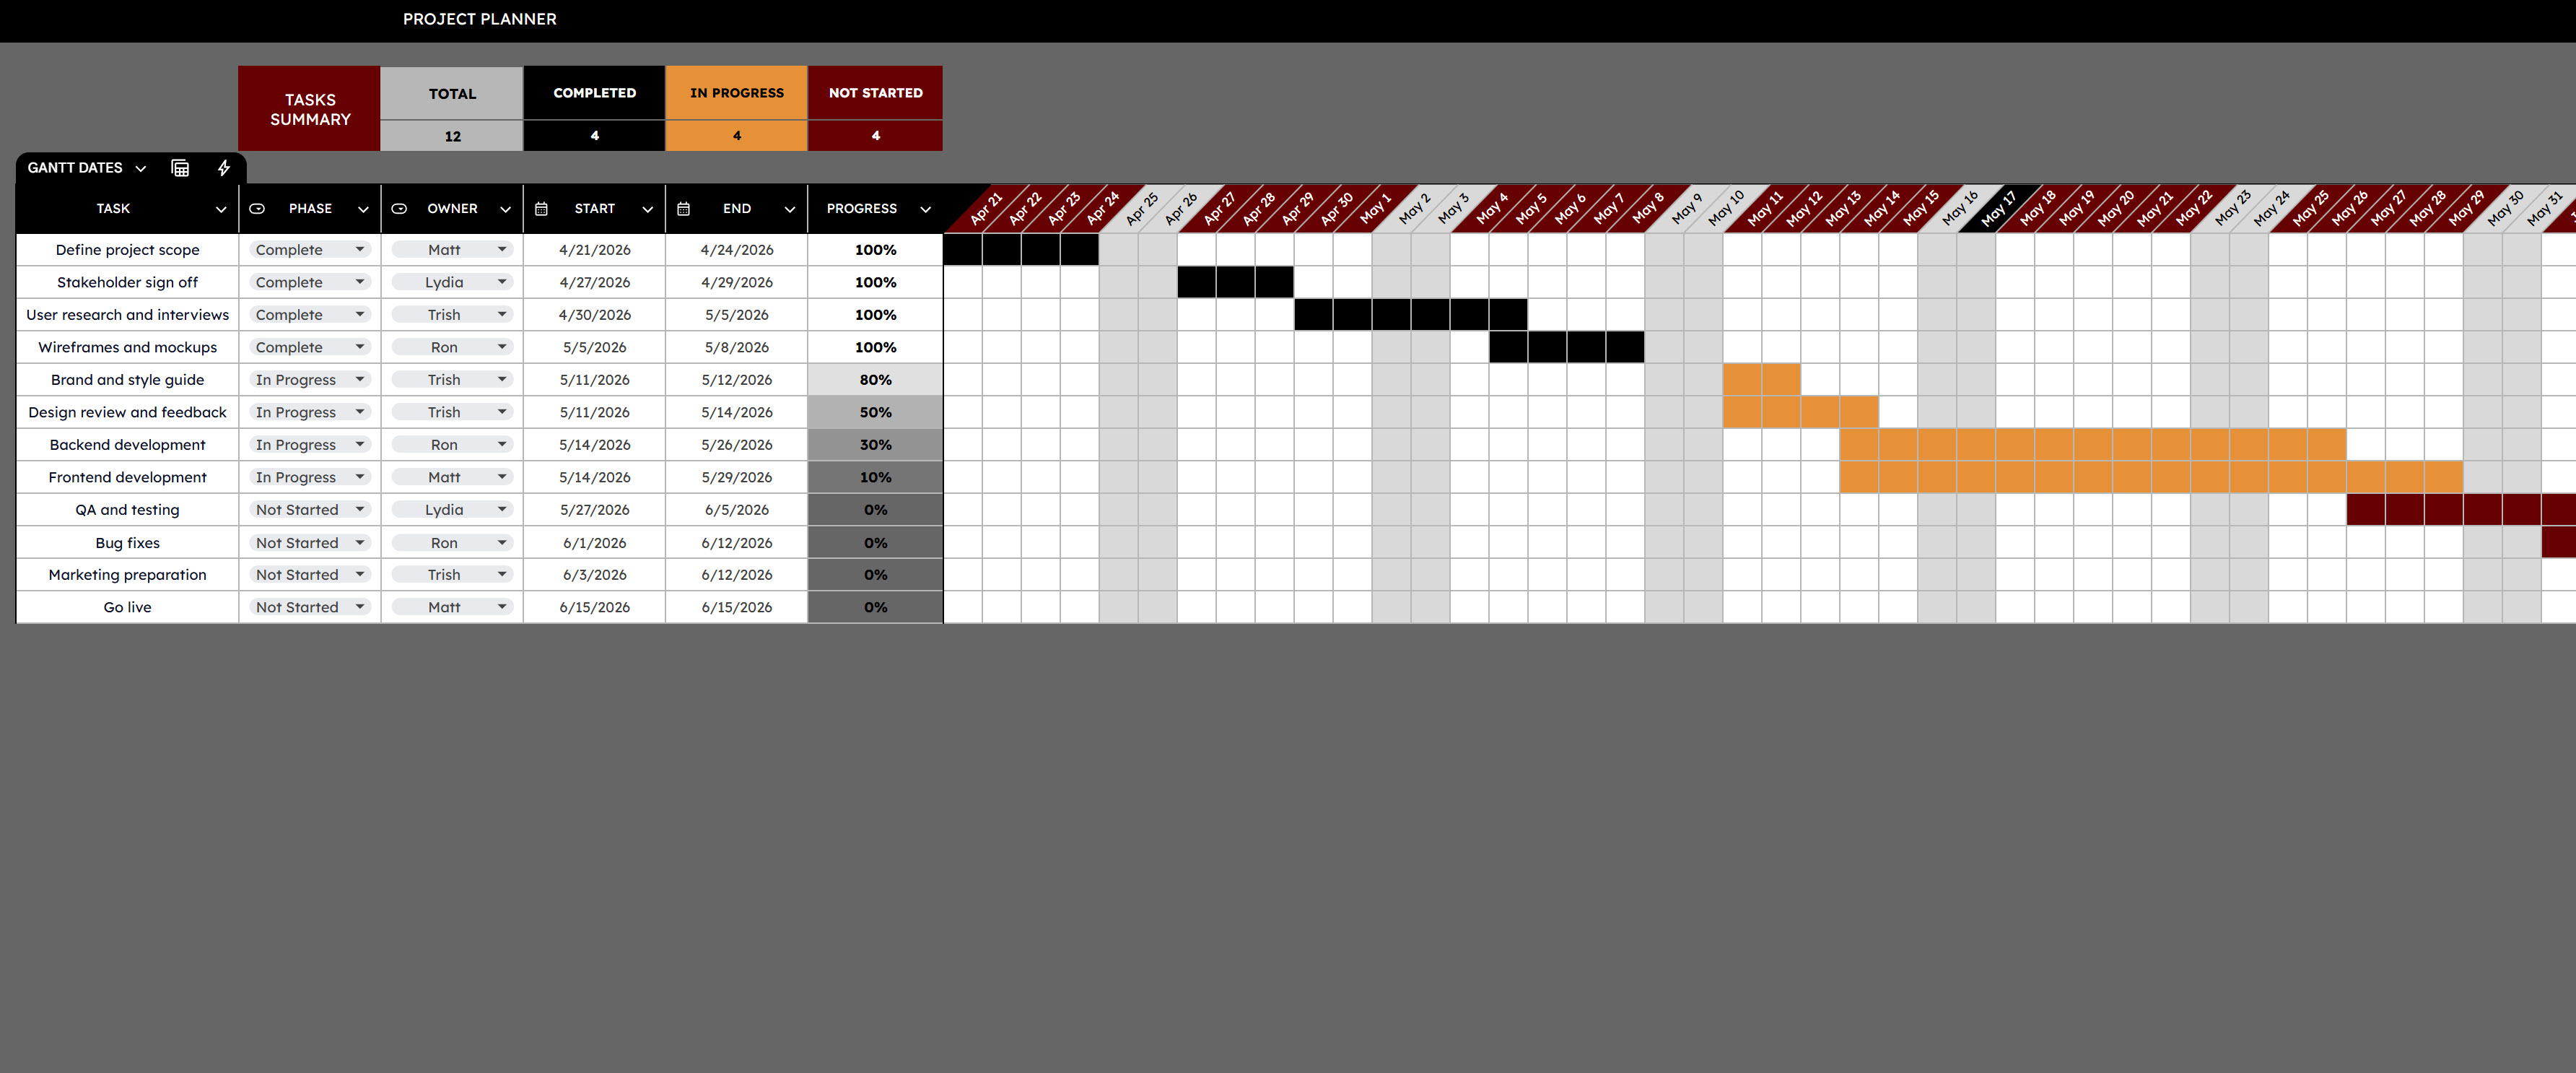
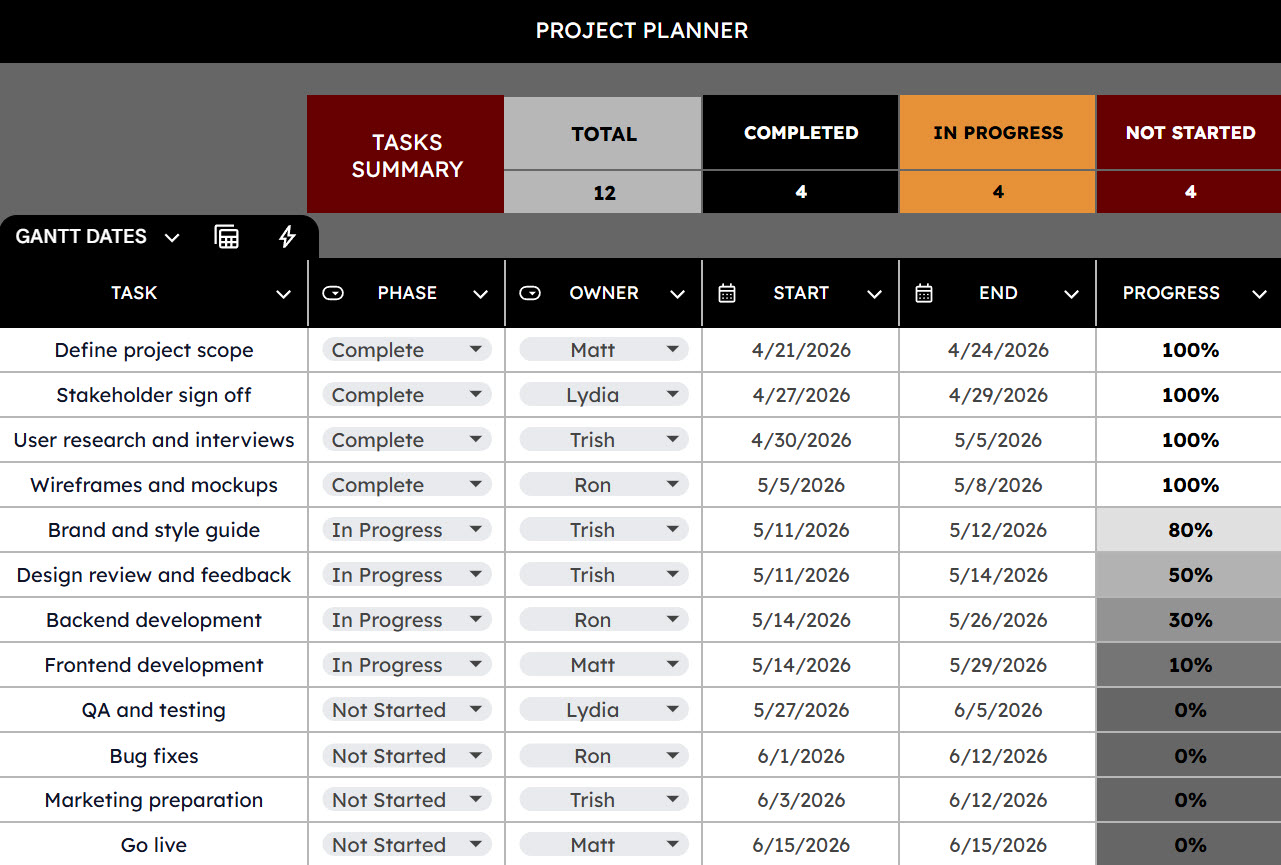
Gantt Chart Data
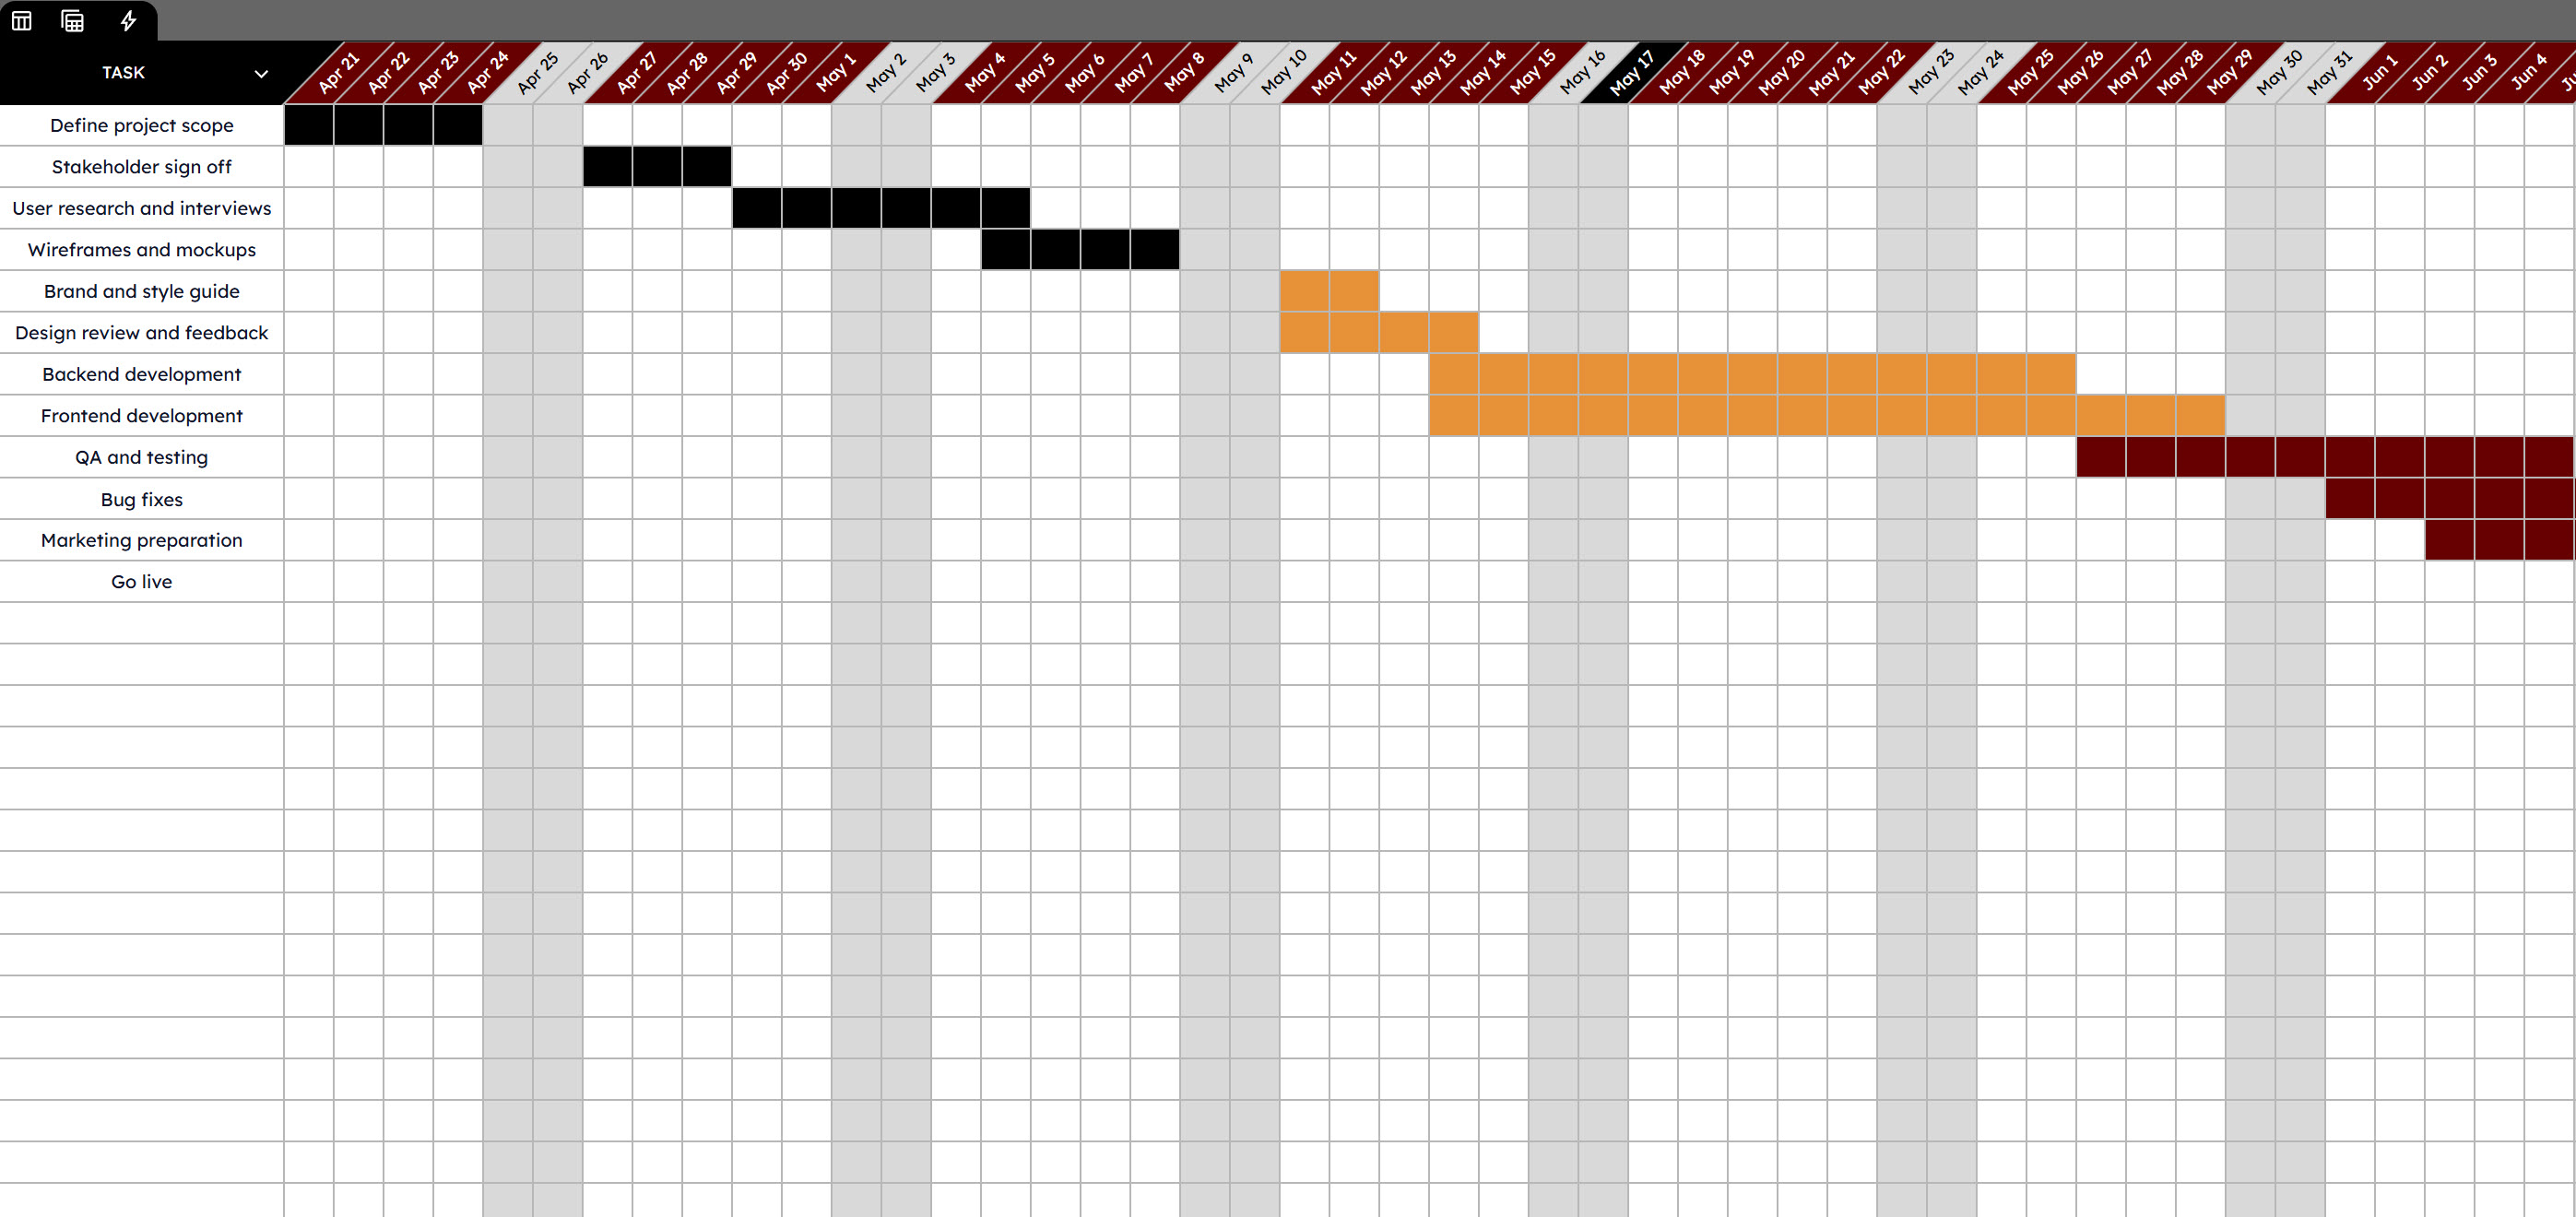
Gantt Chart Expanded for Additional Tasks